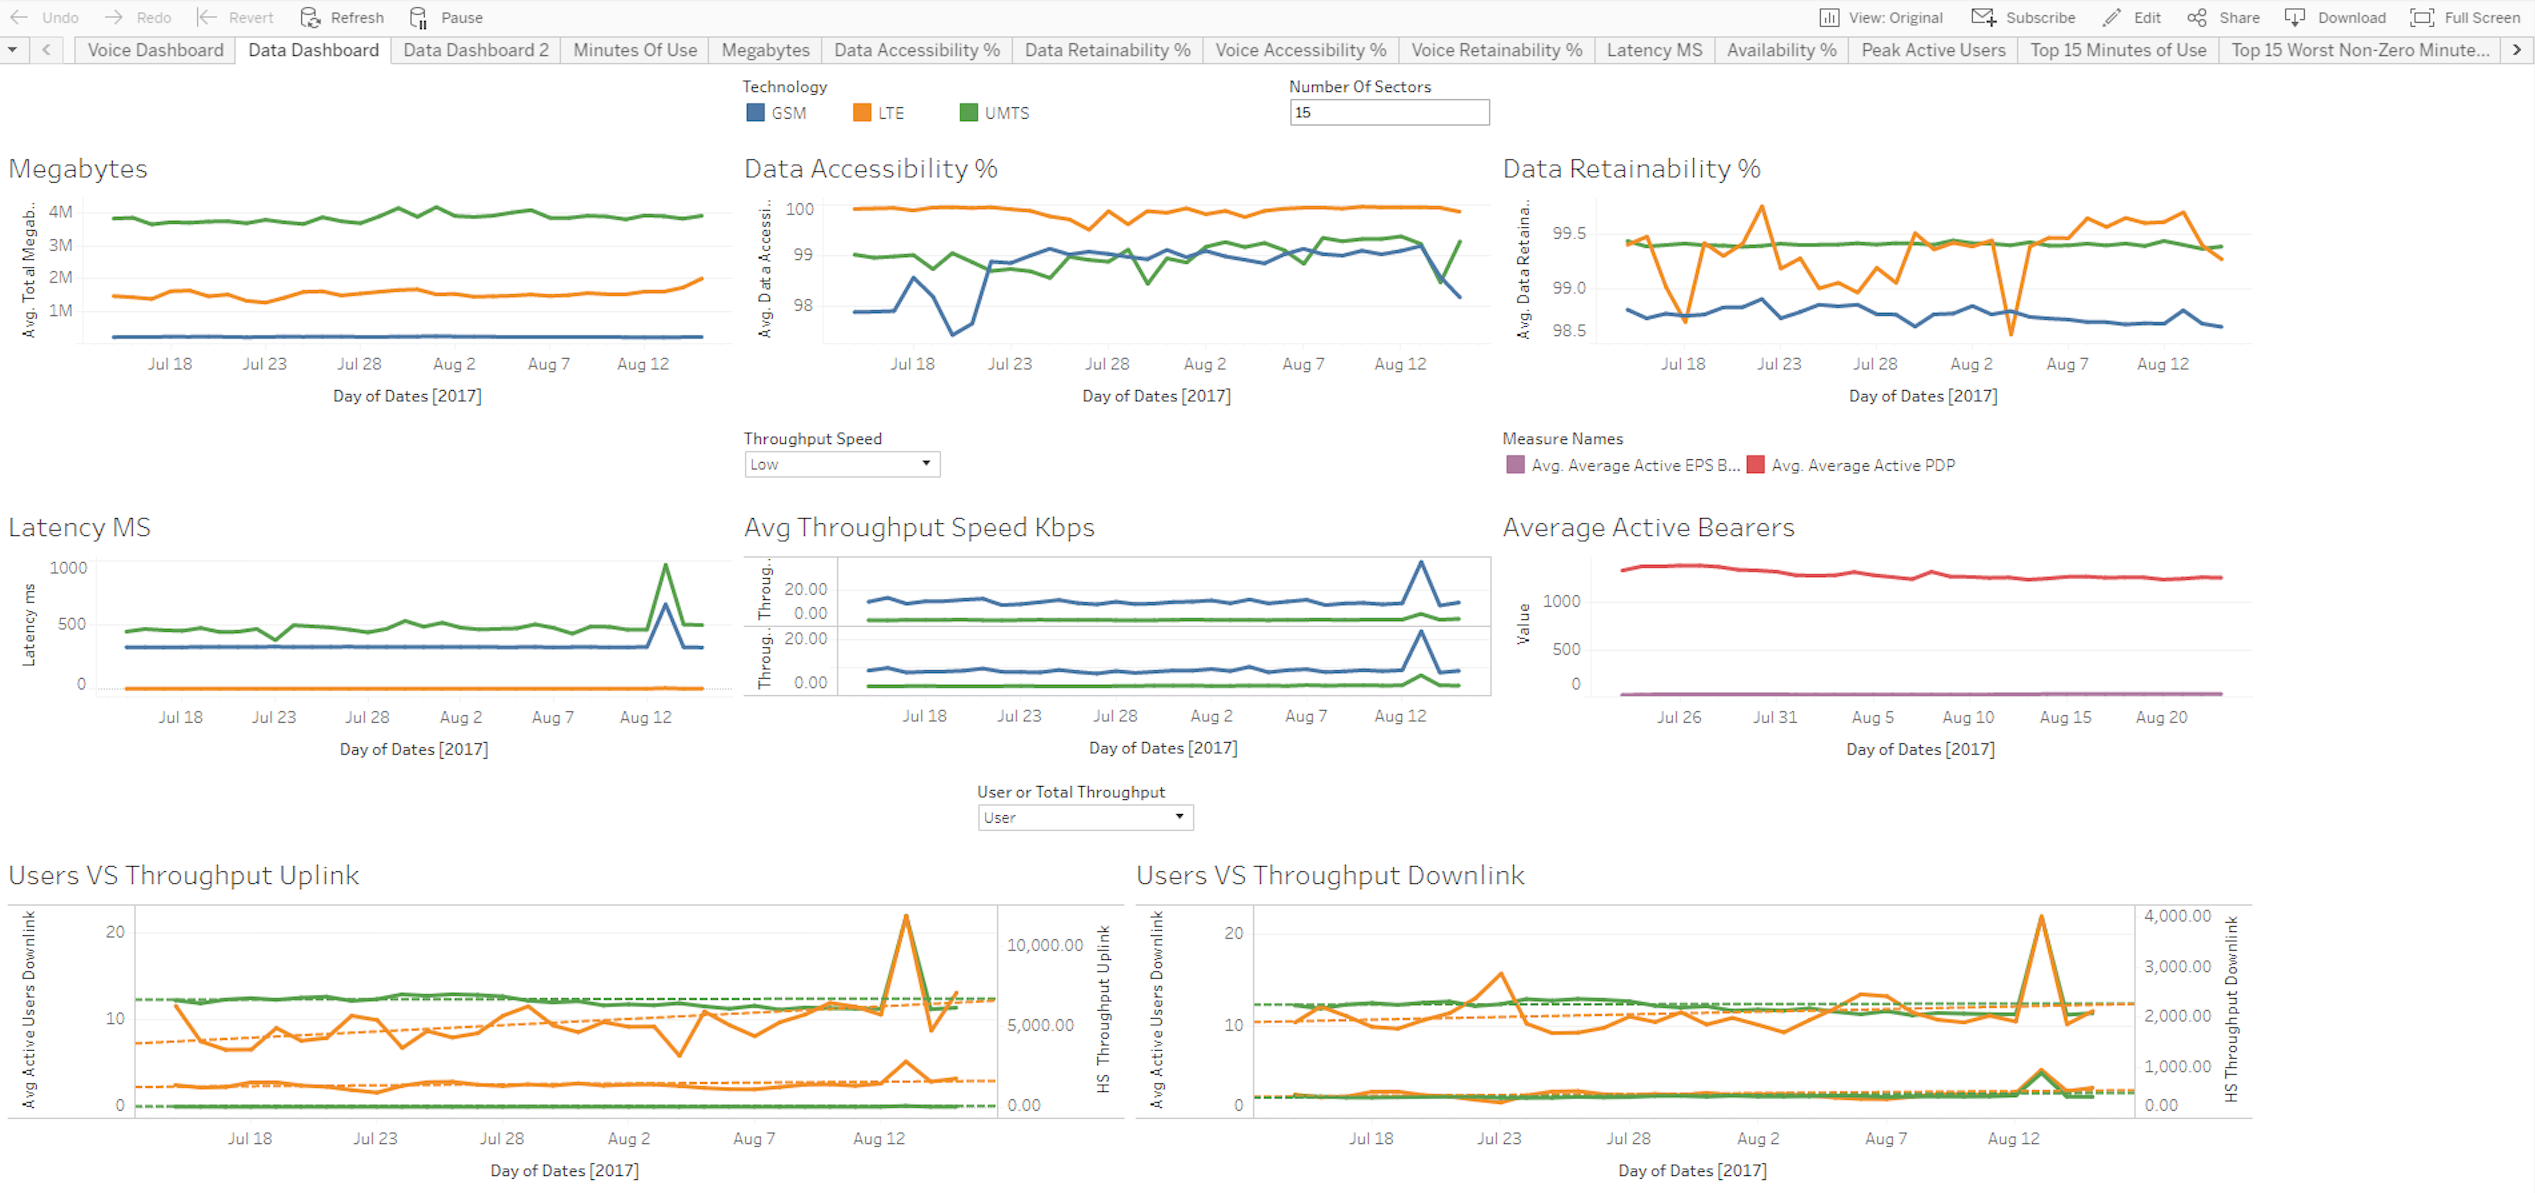
Dashboard: Performance Visualization and Analytics
When assessing your network operations, you do not always have time to wait for and analyze aggregate statistics. With our Dashboard, you can monitor in near real-time any variable on your network that you can measure. Customized widgets can be configured and thresholds can be setup to get visual cues whenever a variable is operating outside of an acceptable range.
Dashboard
View the vital signs of your network directly in your browser or app as they update in near real-time. A visual cue can signal if the current values are outside a predefined range.

Features
Near real-time visualization of your network statistics
Accessible from any web browser (smartphones, tablets, PCs) or the smartphone app
Visual cues warn you when a signal crosses your customized thresholds
Display statistics from any source in your network
Customizable settings allow each operator to focus on the statistics that matter to them
Schedule daily e-mails for the dashboard to be delivered to your inbox
News

Telsasoft Integrates Mavenir’s RAN and Core Network Solutions
Telsasoft Integrates Mavenir’s RAN and Core Network Solutions To Enhance Triangle Communications’ Fixed Wireless Service October 3, 2023, Minneapolis, MN: Minnesota-based wireless technology solutions provider Telsasoft
Telsasoft Wins Competitive Carriers Association 2023 Excellence in Marketing Award
Telsasoft Wins Competitive Carriers Association 2023 Excellence in Marketing AwardPittsburgh, May 4, 2023 – Telsasoft has been named a 2023 Excellence in Marketing Award recipient